Floor Charts
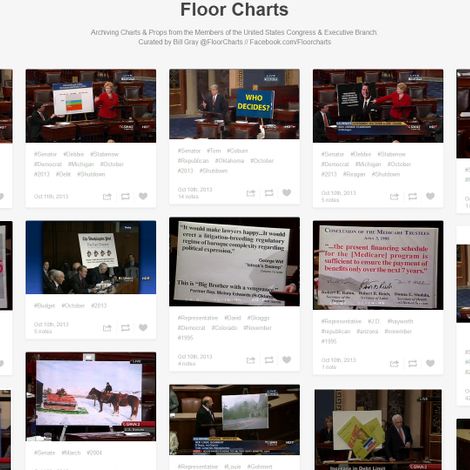
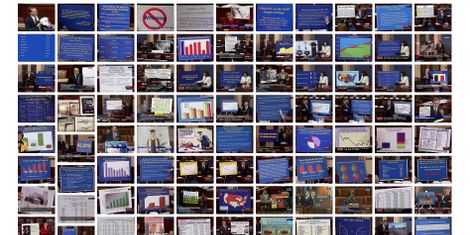
I started an innocent Tumblr in November 2012 after the election was over and D.C. reporters were bored. It's an exhaustive archive of charts/posters/props used by Congress since cameras were turned on and they became popular. It doesn't have a political bend, and it tries to only track each chart once. It uses keyword tagging at the most basic level and it's not nearly as interactive a database as I envision in the future.
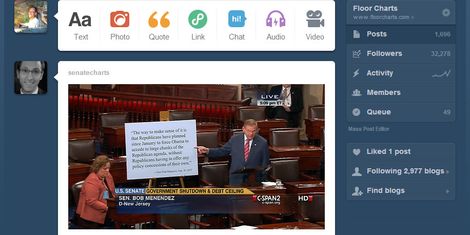
Now it's my life with more-than 1,700 charts. I don't promote often but just launched a Facebook page and Twitter account for it after NPR included me in a story...and TIME graciously honored me as a "Tumblr to Follow in 2013."